

Walk into a freshly turned patient room, and it may look spotless. But looks can kill. A surface can shine and still carry germs no one can see. That gap between clean-looking and truly clean is exactly why hospitals rely on a variety of cleaning verification methods.
The pressure on Environmental Services is real. Infection control, Joint Commission surveys, and HCAHPS/SHEP scores all ride on how well rooms get cleaned.
This guide compares the three cleaning verification methods hospitals use most: visual inspection, fluorescent (UV) marking, and ATP testing. You will see how each one works, where each falls short, what the research actually shows, and how smart teams combine them into one program.
What Is Cleaning Verification? (Why “Looks Clean” Isn’t Clean)
Cleaning verification tries to assess if a room or surface is actually clean. It answers a simple question every EVS director hears from infection preventionists: how do you know?
The honest answer is that you cannot know by sight alone. Dust and streaks are visible. Bacteria, viruses, and biofilm are not. A bed rail can pass a glance and still fail a swab. So knowing how to verify cleaning means measuring things the eye cannot judge.
That is the whole point of using an array of verification methods. It turns “it looks fine” into a number, a mark, or a documented check that survives a survey and holds staff accountable.
The stakes are not abstract. Contaminated surfaces spread healthcare-associated infections, and any surface that a patient or staff touches faces higher risk. Verification is how EVS proves the room was cleaned, not just tidied. It is also what a Joint Commission surveyor wants to see: evidence, dated and documented, that your cleaning process works.
The 3 Main Cleaning Verification Methods at a Glance
Before we go deep, here is the short version. Each of the three cleaning verification methods measures something different, works at a different speed, and costs a different amount. None of them is a silver bullet on its own.
| Method | What it measures | Speed | Best for | Key limit |
| Visual inspection | Visible dirt, dust, debris | Instant | Fast routine rounds | Misses invisible germs |
| Fluorescent (UV) marking | Whether a surface was wiped | Place, then recheck (1 to 2 hours later) | Coaching staff thoroughness | Does not prove disinfection |
| ATP testing | Organic residue (RLU score) | 10 to 15 seconds | Objective spot checks in high-risk areas | Time consuming |
| Microbiological culture | Live microbes | 24 hrs to 7 days | Outbreak or research confirmation | Slow and expensive |
Most hospitals never touch the culture method day to day. It is slow and expensive, saved for outbreaks or studies. The real working trio is visual, fluorescent, and ATP. Let us take them one at a time.
Visual Inspection: The Baseline and Its Blind Spots
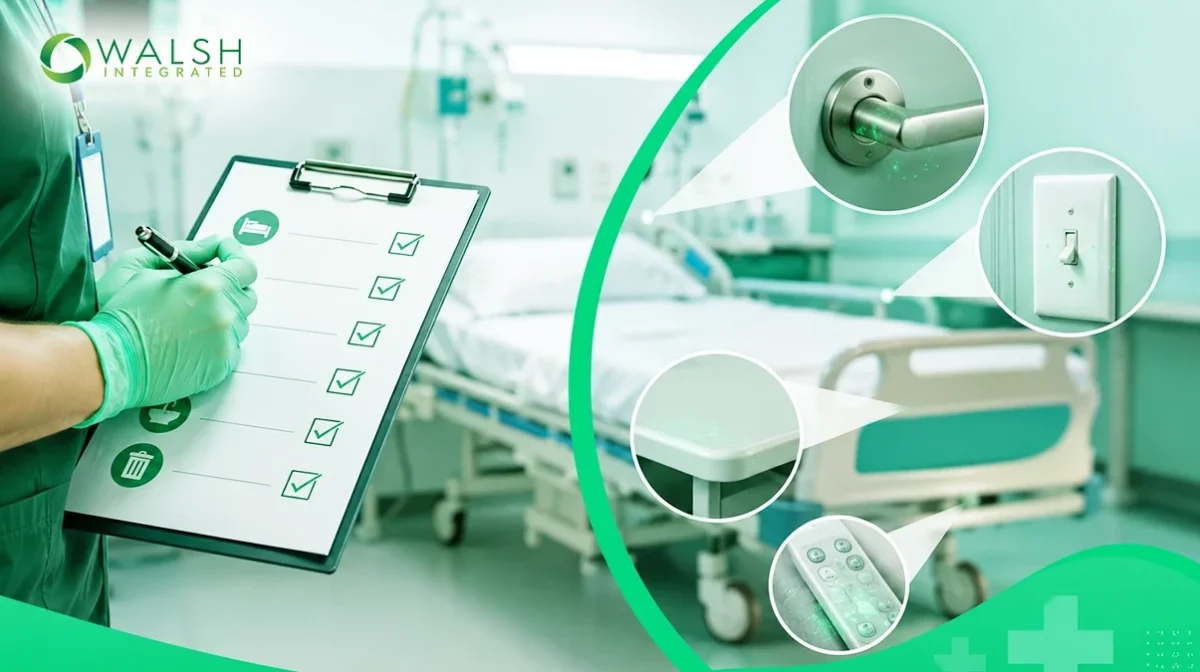
How visual inspection works
Visual inspection is the oldest and simplest method. A supervisor walks the room, checks surfaces against a checklist, and marks pass or fail. It catches the obvious stuff fast: trash left behind, dust on a ledge, a smudged mirror, a missed spill.
Done well, it is more than a glance. A structured visual audit uses a scored checklist, photos of problem areas, and a clear standard for each surface. That structure is what separates a real inspection from a quick look around.
Where visual inspection falls short
Here is the catch; an item that looks clean may still harbor germs. Studies of hospital surfaces have found that visual assessment overstates how thoroughly rooms are cleaned. Door handles usually look clean but often test dirty.
Visual checks cannot see organic residue or microbes. Useful as a baseline, but not proof on its own.
- Strength: instant, cheap, and good for spotting obvious misses.
- Strength: builds daily accountability when tied to a scored checklist.
- Limit: blind to anything smaller than the eye can see.
- Limit: subjective, so scores vary between inspectors.
Fluorescent (UV) Marking: Did They Actually Clean It?
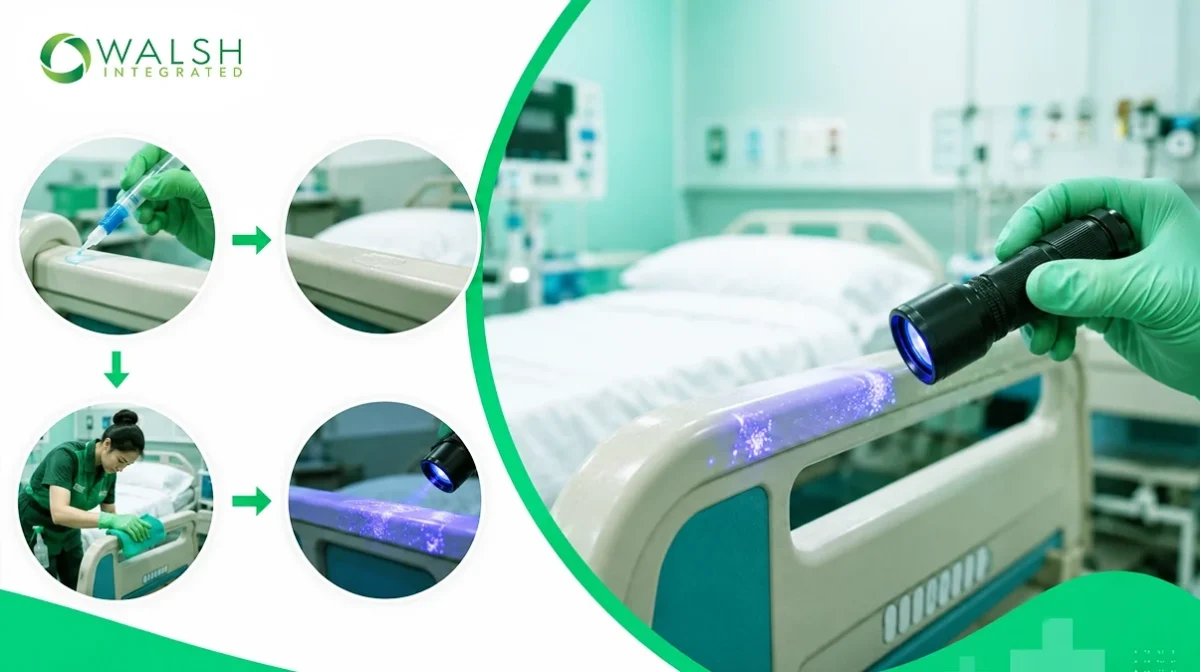
How fluorescent marking works
Fluorescent marking answers one narrow but valuable question: did the cleaner physically wipe this spot? Before a room is cleaned, a supervisor dabs an invisible gel or fluid on high-touch surfaces. The mark is clear in normal light but under a UV flashlight, it glows. A fluorescent marking system turns that simple idea into a repeatable audit.
After cleaning, the auditor returns with the UV light. If the mark is gone, the surface was cleaned. If it still glows fully, that spot was skipped. Simple, visual, and hard to argue with when you are coaching staff.
Strengths and limits
The invisible fluorescent gel used in hospitals is cheap and easy to place. It gives you a clean coaching moment: staff can see exactly which surfaces they missed. That makes uv marking cleaning verification a strong training and accountability tool, especially for terminal cleaning.
But it has a hard limit. Fluorescent marking proves contact, not cleanliness. A surface can be wiped, clearing the gel, and still carry germs if the wipe was dirty or the disinfectant was wrong. It tells you the cloth passed over the rail. It does not tell you the rail is safe.
- Strength: shows thoroughness, which surfaces got touched and which got skipped.
- Strength: cheap, visual, and excellent for staff coaching.
- Limit: proves wiping, not disinfection.
- Limit: needs two visits, one to place marks and one to check.
ATP Testing: Measuring What the Eye Can’t See
How ATP testing works
ATP testing goes a layer deeper. ATP stands for adenosine triphosphate, the energy molecule found in all living cells and organic matter. If bacteria, blood, or biological residue sit on a surface, ATP is there too. Measure the ATP, and you get a proxy for how much organic soil remains.

The atp swabbing technique is quick. An auditor swabs a set area, inserts the swab into a handheld reader, and gets a score in 10 to 15 seconds. The result comes back in relative light units, or RLU. Lower is cleaner. A zero is sterile.
Strengths and limits
The big win is objectivity. Adenosine triphosphate cleaning verification gives a number, not an opinion. That number is perfect for spot checks in operating rooms, ICUs, and other high-risk areas, and it feeds cleanly into ATP monitoring software for trending and benchmarks. When staff see the score drop after a re-clean, the feedback lands.
It is fair to name the atp testing limitations hospitals should know. ATP measures organic residue, not live microbes directly, so it is a strong proxy rather than a microbial count. Readings vary between device brands, and residue from some cleaning chemicals can affect results. Used well, though, it is the most objective handheld check most EVS teams can run.
- Strength: fast, objective, and numeric, ideal for high-risk spot checks.
- Strength: pairs with software for trends, benchmarks, and staff feedback.
- Limit: a proxy for organic soil, not a direct microbe count.
- Limit: benchmarks and readings differ across devices.
Visual – Surface Looks Clean
Fluorescent Marking – Was Cleaned
ATP – Surface is Actually Clean.
Put the three together and the pattern is clear. This cleaning verification comparison shows why the atp vs fluorescent marking cleaning verification question is the wrong way to frame it. They do not compete. They answer different questions.
| Factor | Visual inspection | Fluorescent (UV) marking | ATP testing |
| What it proves | Surface looks clean | Surface was wiped | Organic residue level |
| Objectivity | Subjective | Semi-objective | Objective (RLU number) |
| Speed | Instant | 1 to 2 days | 10 to 15 seconds |
| Cost per check | Very low | Low | Medium (swab + reader) |
| Best use | Daily rounds | Staff coaching | High-risk spot checks |
| Main gap | Misses invisible soil | No disinfection proof | Not a microbe count |
Read the table across, not down. Visual tells you it looks right. Fluorescent tells you it was touched. ATP tells you how much organic soil is left. Together, they cover each other’s blind spots.
What the Research Says About Cleaning Verification
The evidence backs the layered view. The 2022 SHINE trial, published in Clinical Infectious Diseases, compared ATP monitoring and fluorescent marker feedback after terminal cleaning across six ICUs. The ATP method was linked to a lower rate of multidrug-resistant organisms than the fluorescent period, while the fluorescent marker showed no statistically significant effect on those infection rates.
The SHINE trial also tracked a practical cost: time. Adding ATP checks raised room turnaround by about one minute, while the fluorescent method added closer to four and a half minutes. For a busy discharge unit, that difference matters when you plan staffing and bed flow.
Still, none of this makes fluorescent marking useless. A 2025 proof-of-concept study in the Journal of Hospital Infection found fluorescence detected contamination on every surface tested, with much higher readings in marked areas than in controls. It even flagged chemical and drug residue that ATP can miss. Each method saw something the other did not.
US guidance points the same way. The CDC’s Options for Evaluating Environmental Cleaning lists visual assessment, fluorescent markers, ATP, and cultures as complementary tools, not rivals. The takeaway for EVS leaders is direct: no single method proves clean by itself.
Which Cleaning Verification Method Should Your Hospital Use?
The right answer is: ALL THREE! Pick based on the question you need answered and the risk in that area. A supply closet does not need an ATP swab. An operating room does.
Building a layered verification program
A practical program stacks the methods so each covers the others’ gaps. Think of it as three lenses on the same room.
- Use visual inspection everywhere, every day, tied to a scored checklist for baseline accountability.
- Use fluorescent marking for staff coaching and terminal-clean audits, to prove thoroughness.
- Use ATP testing for objective spot checks in high-risk areas like ORs, ICUs, and isolation rooms.
- Reserve cultures for outbreak investigation or validation studies, run with your lab.
Match the method to the stakes. Low-risk spaces lean on visual and occasional fluorescent checks. High-risk spaces earn ATP verification and tighter frequency. That is how you spend effort where infection risk is highest.
Frequency matters as much as method. A common approach is daily visual scoring on every unit, weekly fluorescent audits for coaching, and ATP swabs on a sample of high-touch surfaces in critical areas after each terminal clean. Sample enough rooms to trust the trend, but not so many that the program stalls. The goal is steady evidence over time, not a one-time perfect score.
How Software Ties the Methods Together
Three methods make three streams of data. On paper, that is three binders no one reconciles. This is where automated cleaning verification earns its keep. Hospital cleaning inspection software pulls visual scores, fluorescent audits, and ATP results into one record per room, per shift, per surface.

That single view changes the conversation. You can trend RLU scores over time, flag surfaces that fail repeatedly, and show a surveyor a clean audit trail on demand. You can coach a specific person on a specific rail with the photo and score attached. The methods stop being separate rituals and become one accountability loop.
For teams still juggling clipboards and a stack of swab printouts, that consolidation is the real upgrade. The verification method tells you what happened. The software makes it stick.
Final Thoughts
No single check proves a hospital room is clean. Visual inspection sees the obvious, fluorescent marking proves thoroughness, and ATP testing measures the residue you cannot see. The strongest cleaning verification methods programs use all three, matched to risk and logged in one place. Want to see how Walsh Integrated ties them together? Schedule a live demonstration, or download the hospital buyer’s guide to compare your options.
Frequently Asked Questions
The main methods are visual inspection, fluorescent (UV) marking, and ATP testing. Hospitals also use microbiological cultures for lab-grade confirmation during outbreaks.
ATP measures organic residue the eye cannot see, so it catches contamination that visual checks miss. Most programs use both, since each answers a different question.
A common healthcare pass threshold is 100 RLU or below on a high-touch surface. Each facility can set its own limit based on its device and risk level.
No. Fluorescent marking shows whether a surface was physically wiped, not whether microbes were removed. It measures thoroughness, not disinfection.
Combine visual inspection, fluorescent marking, and handheld ATP testing, then log results in cleaning inspection software to trend scores and hold staff accountable.
