
A near perfect cleaning inspection score is not always good news. Sometimes it hides a rushed or pencil whipped inspection. Your cleaning inspection software gives you warning signs a paper checklist misses: scores that looks too good to be true, to few questions, a two minute walk inspection, and the gap between visual and ATP proof. Here are the five red flags to watch out for, and how to read your EVS data. Look for the truth, not the goal.
The trap of chasing a number
Set a cleanliness goal of 95 percent and watch what happens. Teams tend to hit it. Not always by cleaning better, but sometimes by marking pass, pass, pass until the math works. The goal gets met. The average looks fine, even as the data stops reflecting reality.
We have shared this message with EVS teams for 30 years. The aim is not to hit a goal. The aim is to hit the truth. A cleaning inspection is meant to mirror reality, including the parts that aren’s great. When you set a target for your scores … “We need to be performing at a 96% pass rate!” … your people are not stupid; they will give you that score. The moment a score becomes a target, it stops being a measurement. So when we review a facility’s data, we are not looking for high numbers. We are looking for honest ones.
Why paper hides these red flags
Here is the hard truth about clipboards, paper, and excel. Paper cannot tell you how long an inspection took. It cannot count the questions asked. It won’t confirm a photo was captured or highlight an inspector who never records a fault. Paper shows you the score but buries every signal that would tell you whether to trust it.
That is the real case for hospital cleaning inspection software. It captures the duration, the question count, the photos, and the signatures that turn a raw score into something you can question. Without that data, the red flags below stay invisible. With it, they are easy to see and easy to coach.
The 5 critical red flags in your cleaning inspection data
A score percentage tells you very little on its own. Context is everything. These are the five red flags we check before trusting any inspection score, and the software is what makes each one visible.
Red flag 1: a score that looks too good to be true
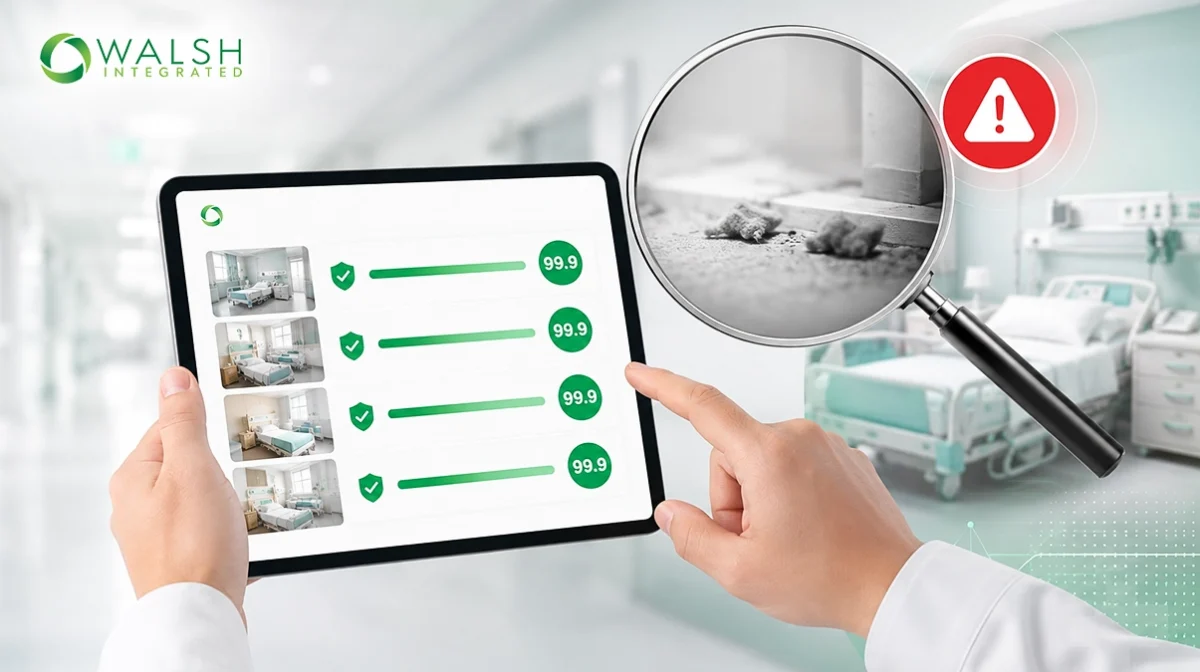
An inspector posting 99.9 percent across dozens or hundreds of inspections is worth a closer look. Real rooms have real problems. Dust settles. Floors get missed. A flawless record often means the inspection is moving too fast to catch anything. You need a way to examine the duration, the photos, and whether the answers vary or every line is a perfect pass.
Red flag 2: mistaking an honest low score for poor work
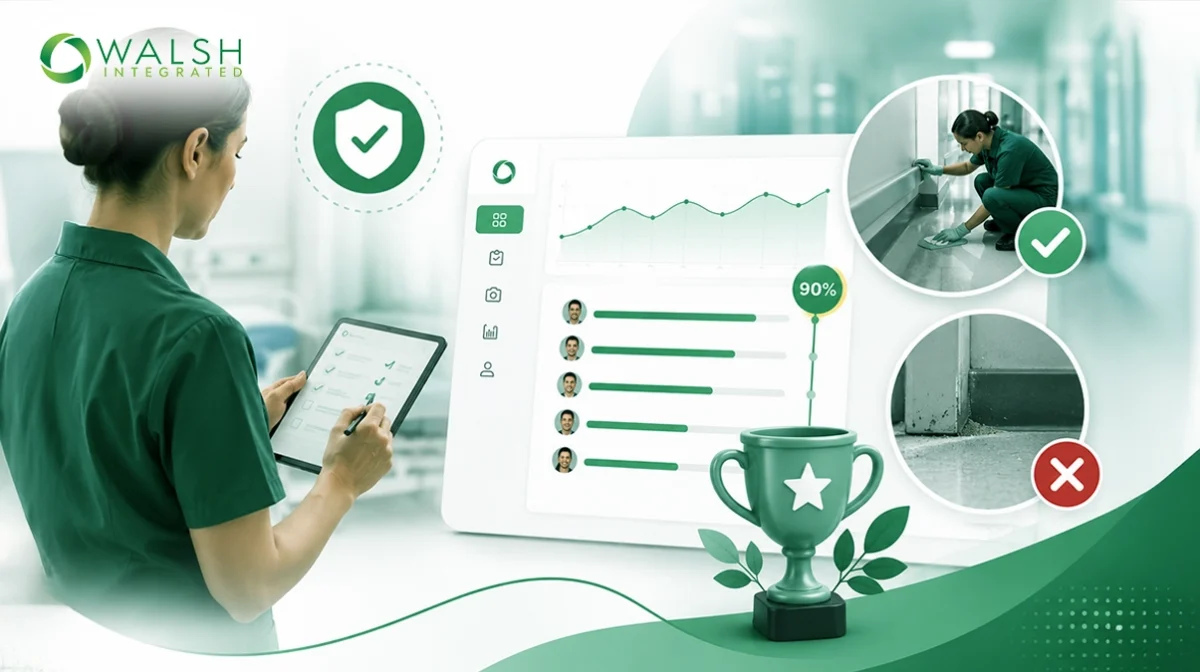
Flip it around. An inspector averaging 90 percent is frequently your best one. That number says that they are doing honest inspections, they are thorough, they catch problems, and they document them. We need to be careful that we don’t penalize lower scores. A demanding inspector protects patients. A generous one hides risk. So we must thank the careful, lower scoring supervisors and managers , because their data can help you improve.
Red flag 3: a quietly falling question count

Scores can climb for the wrong reason. If someone asks fewer questions per room, inspections get faster but shallower, and the average can drift up simply because there is less chance to find a fault. A thorough inspection answers ten or more questions.
Think about your housekeeper. If you only as one or two questions when inspecting the room, or if you only focus on the things that fail, that housekeeper will get a low score for that room. On the other hand, if you are diligent and thorough, maybe you ask 10 or 15 questions, then that one or two failures is a much smaller part of the score. In other words. If you want to be fair to your housekeepers, you need to be asking a number of questions. You need to look at a number of different cleaning items or issues in every room. That’s the only way to be fair to your housekeepers and, ultimately, your housekeepers.
Red flag 4: the two minute inspection

Time is a hard truth; is your software timing each and every inspection? Are you getting reports that highlight inspections that are unbelievably fast? A thorough room inspection runs from five to ten minutes, or more. A series of 100% inspections that each lasted less that a minute tells a disappointing story. No one checks a patient room properly in 60 seconds. Pair a suspiciously high score with a suspiciously short duration, and you need to take that supervisor or manager aside and review their work.
Red flag 5: the gap between what you see and what you test
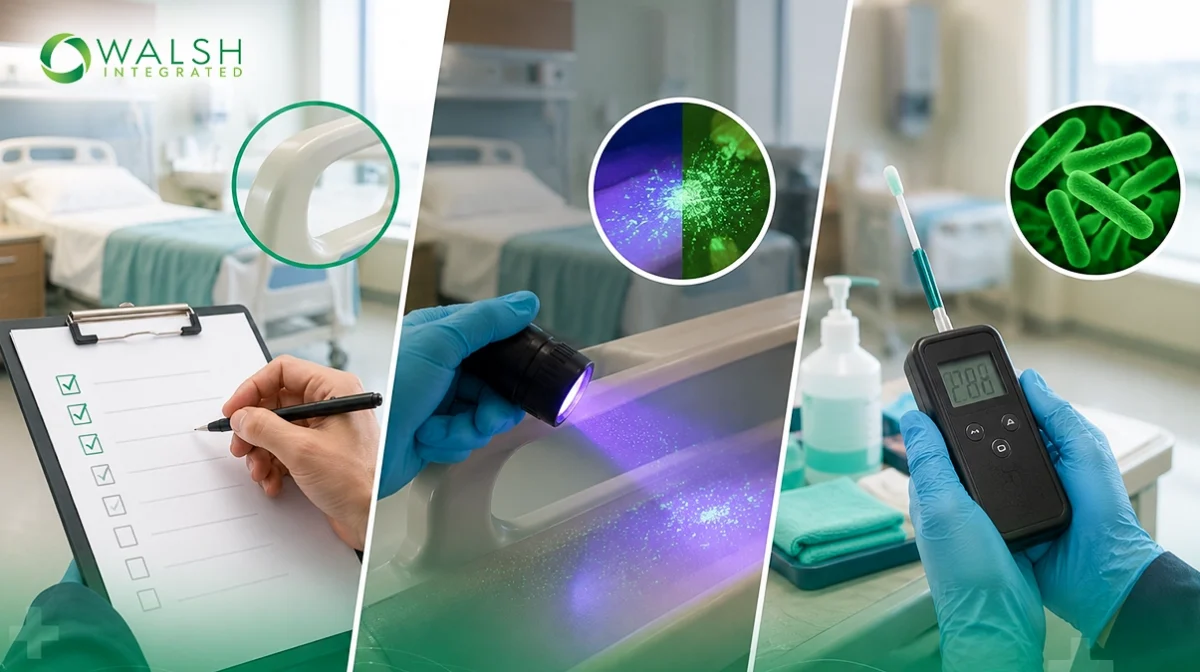
This is the red flag most facilities miss. Visual inspection has a blind spot. A surface can look spotless and still be contaminated. The CDC states that visual assessmentshould not be relied on as the only indicator of cleanliness, which is why it recommends ATP testing and fluorescent marking as well.
The numbers make the point. From our clients data, we have found that visual inspections VS fluorescent marking VS ATP can have significantly different results. For example, visual inspections might average 90% ,but fluorescent marking could average 85% and ATP testing might only average an 80% pass rate. What this means is that visual inspections tells us. “Does it look clean”, fluorescent marking tells us “Was it cleaned” and ATP tells us “Is this item or surface actually clean?” These three different methodologies are all critical to a well-rounded QA program that protects your Patients and rewards your staff.
That is why we encourage all our client to run ATP monitoring and fluorescent marking verification, so that visual inspections are supported.
How to audit your own cleaning inspection scores
You do not need us in the room to start reading your data better. Run this quick check on your own dashboard this week.
- Sort evaluators by score and look hard at anyone above 98%. Remember that low scorers tend to be more diligent.
- Open three of their inspections and check the duration. Under two minutes is worth a second look.
- Count the questions answered per inspection. Are there 2?, 5?, 10? If the number is low , ask why.
- Confirm photos exist, both of the room number and of any deficiency found.
- Compare a visual score against an ATP or fluorescent result on the same surfaces, and think about that gap.
- Check that low scoring housekeepers were asked enough questions to earn a fair number.
Score patterns and what they really mean
Put it together and most score patterns fall into a few buckets. Here is the cheat sheet we use when we read a client’s data.
| What you see | What it often means | What to do |
| 99%+ across many inspections | Inspections moving too fast to catch faults | Open inspections, check time and photos – then talk to that inspector. |
| ~90% from a steady inspector | A critical, trustworthy evaluator | Reinforce the behavior, do not penalize. Are they working with Housekeepers to improve? |
| Score rising as questions fall | Faster, thinner inspections | Talk to that inspector, restore the full question set |
| High visual score, low ATP pass rate | Surfaces look clean but are not | Increase ATP and Fluorescent testing, coach high touch points |
| A housekeeper at 0% or 25% | Maybe one question, one fail | Confirm enough questions were asked first. Consider remedial training for that Housekeeper. |
How software and support make honest scoring possible

Reading data this way is a skill, and it depends on having the data and the reports in the first place. Our hospital cleaning inspection software, the QA Inspector module, captures the duration, question count, photos, and signatures that make this kind of audit possible. The data is built to be questioned, not just totaled. None of that is possible with a stack of paper checklists.
The tool is only half of it. The other half is a Walsh partner who sits with your team and reads the numbers with you, so the five red flags become visible. . We do that on a regular basis with every client, walking through the data line by line and helping leaders decide what to trust and what to question. Honest scoring is a habit, and habits hold when someone reinforces them.
This is the work we have done with 170+ leading health systems , and VA Medical Centers for three decades. Our UC Davis Health case study shows what defensible, honest cleaning data looks like in practice across a large hospital and health system operation.
Want to know whether your scores tell the truth? Schedule a live demonstration and we will read your data with you: /quality-automation-software/schedule-your-live-demonstration/
Frequently asked questions
Not always, but it is a red flag. Verify duration, question count, and photos before trusting near perfect scores across many rooms.
An honest one. A thorough, well documented 80 percent beats an inflated 99 percent. The aim is truth for truth to reflect real cleanliness.
It records duration, question count, photos, and signatures, so shallow or rushed inspections are easy to spot and coach.
Visual inspection misses unseen contamination. Comparing ATP to visual reveals where surfaces look clean but are not.
From five to ten minutes for a thorough check. Repeated two minute inspections suggest corners are being cut.
Yes. A careful inspector who scores lower is often catching real problems, which makes their data more trustworthy, not less.
